Chiller monitoring
Reading a legacy HMI without changing the chiller hardware.
I mapped HMI readings, built the acquisition path, and integrated the team's classifier with the monitoring workflow.
System overview
- Input
- Eleven operating parameters from a Pro-face HMI
- Processing
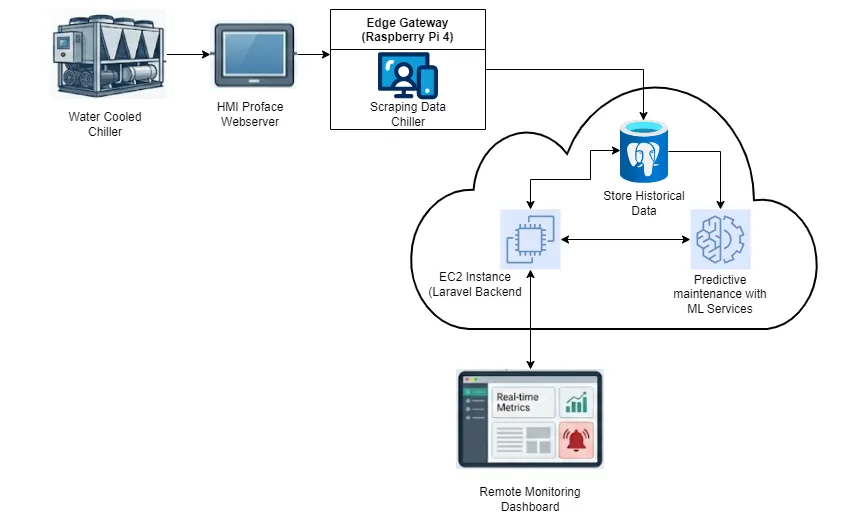
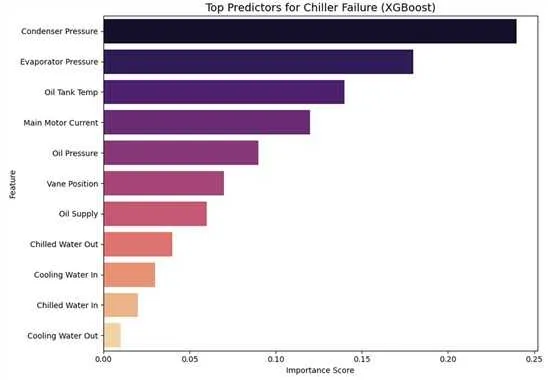
- Raspberry Pi acquisition, cloud storage and XGBoost condition classification
- Output
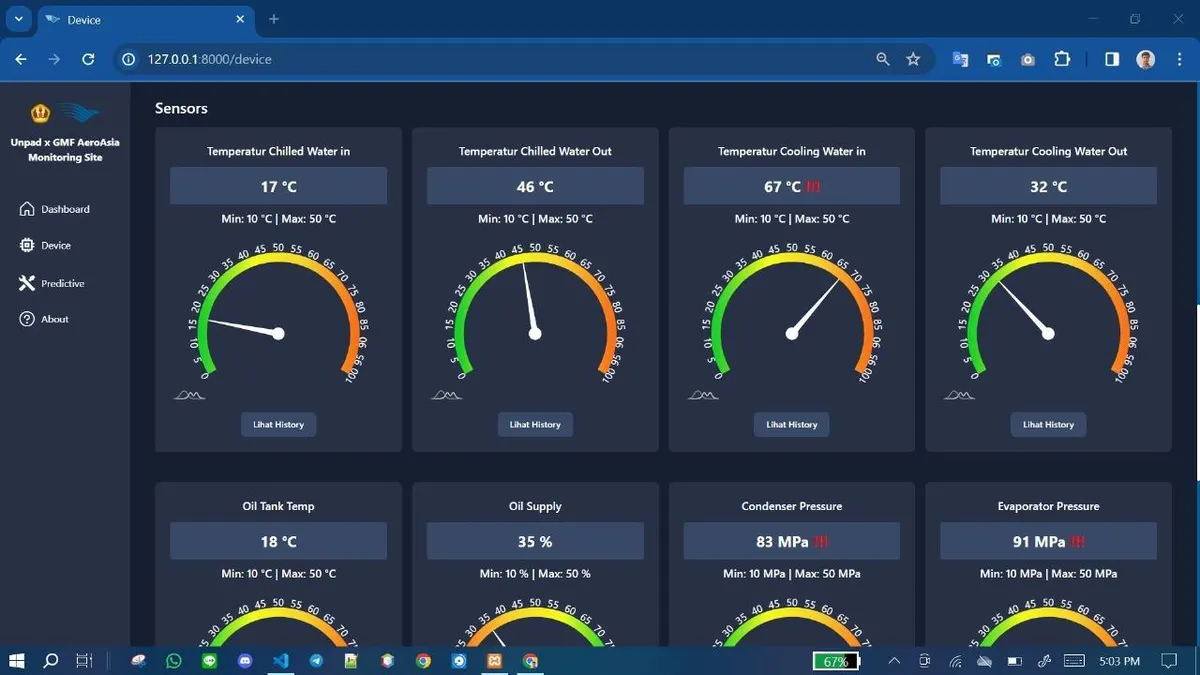
- Remote readings and history with normal or potential-failure labels
Teammates developed the dashboard and machine-learning approach.
Equipment and remote view
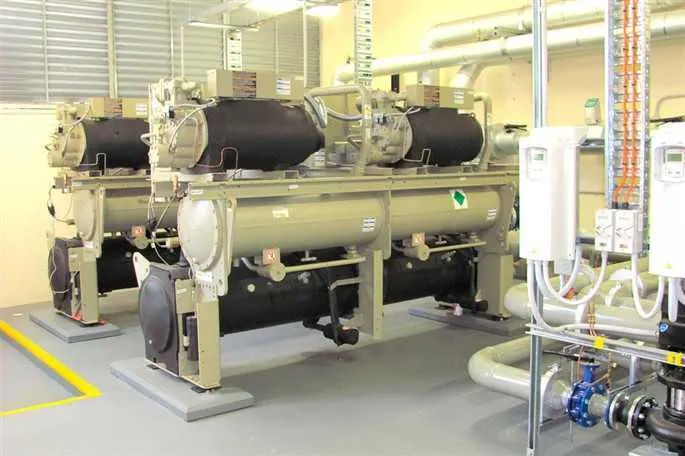
The Pro-face HMI already exposed operating data through a web page. Reusing that interface over local Ethernet let the monitoring application read existing values while leaving the chiller hardware unchanged.
Water-cooled chiller
Remote monitoring dashboard
Trace the acquisition and application path
I mapped HMI addresses by changing values in the manufacturer’s simulator and observing the matching entries in its data table. The Raspberry Pi then requested HMI pages over Ethernet, parsed the eleven parameters and sent timestamped readings to the application endpoint.
HMI-to-dashboard system path
| Layer | System behavior and my contribution |
|---|---|
| HMI discovery | I changed simulator values and mapped the corresponding entries in the data table. |
| Edge acquisition | The Raspberry Pi requested HMI pages, parsed mapped fields and added timestamps. I configured the device and built the acquisition path. |
| Application integration | Readings went to the web team’s endpoint and PostgreSQL/AWS storage path. I connected acquisition, storage and classifier output. |
| Condition classification | The team’s XGBoost model labels normal and potential-failure conditions. I integrated it with the monitoring workflow. |
Compare readings at the site
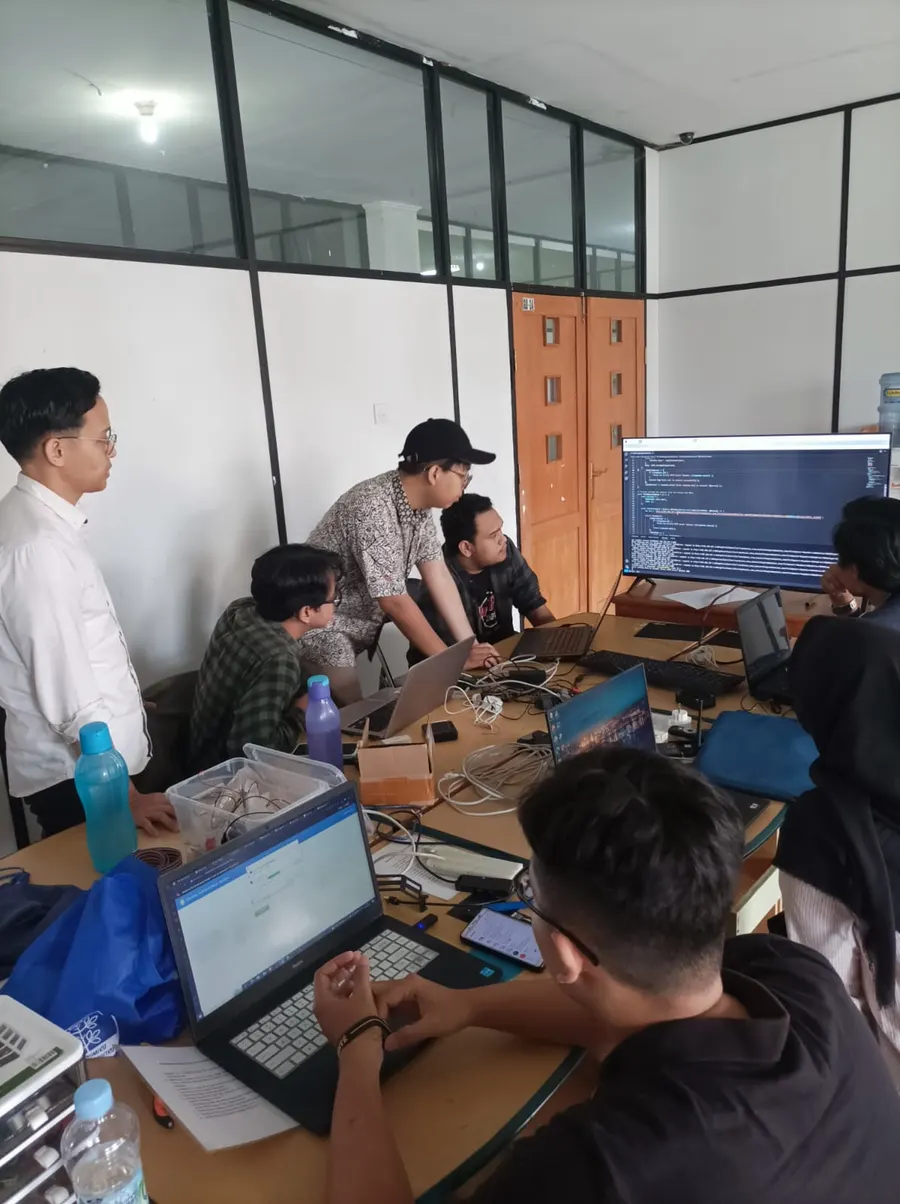
During on-site implementation, we compared readings shown in the website with values at the chiller.
On-site implementation
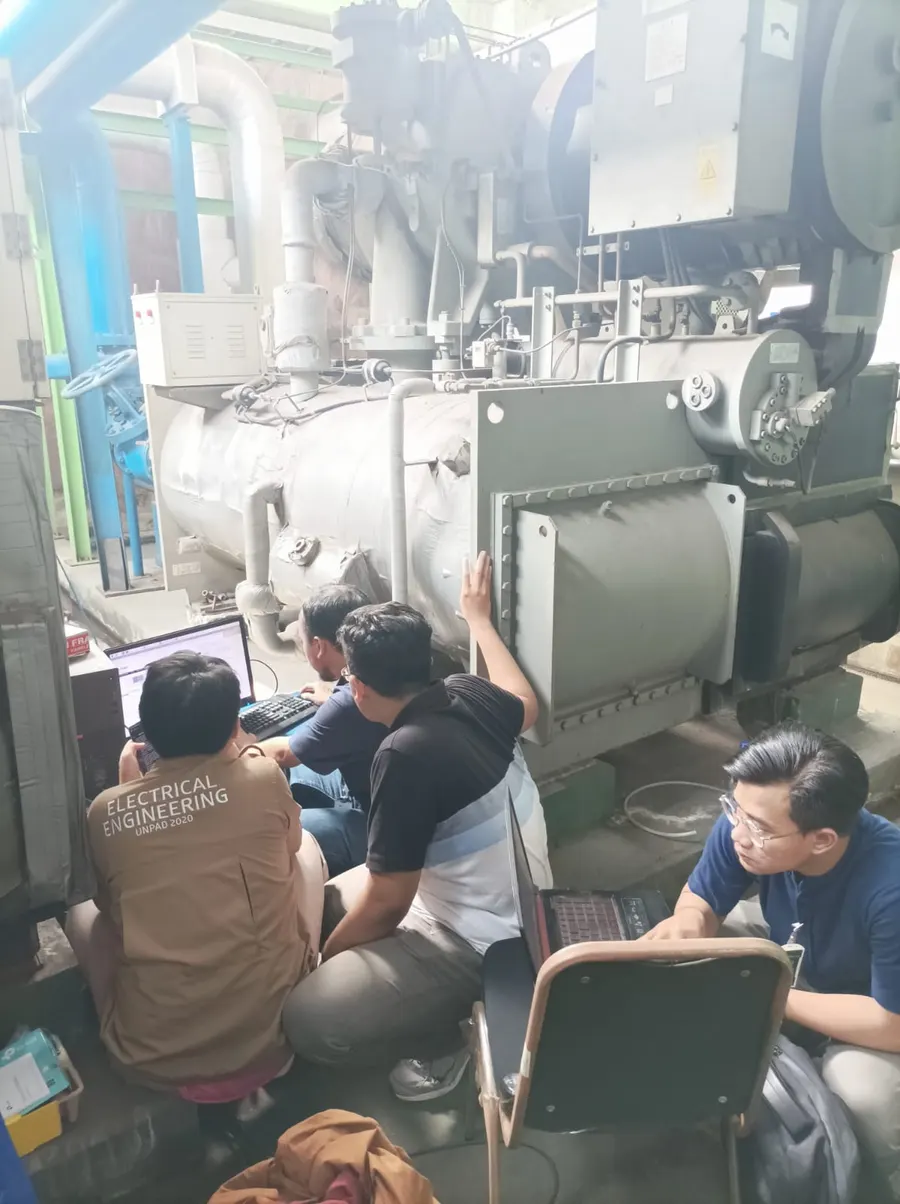
Team development session
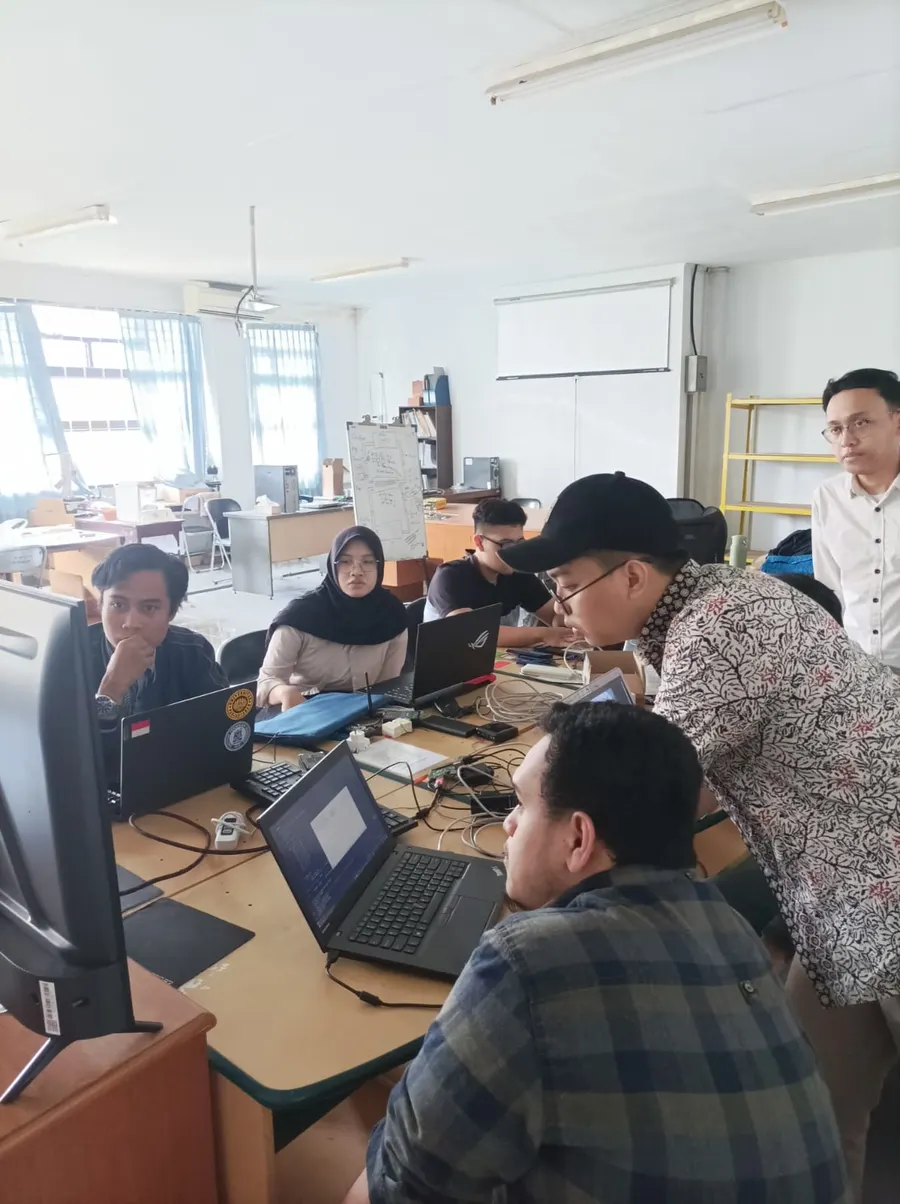
Team review session
Review the classifier evaluation
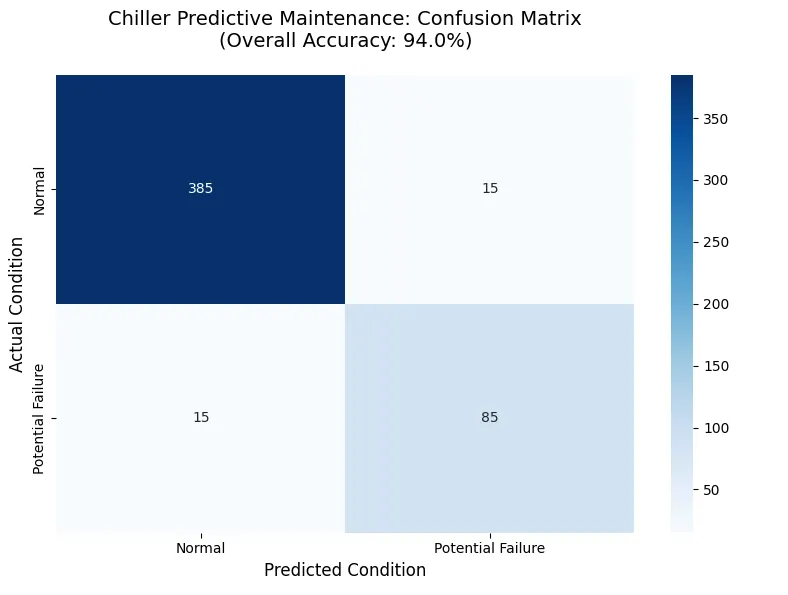
The matrix shows class-specific errors alongside correct classifications. The evaluation dataset and split are unspecified, so these counts are not a field-performance benchmark.
Confusion matrix
Feature importance
| Check | Result |
|---|---|
| Evaluation examples | 500 |
| Correct classifications | 470 of 500 (94%) |
| Potential-failure recall | 85 of 100 (15 missed) |
| On-site reading comparison | Website values compared with machine readings |